In developing the dual etalon frequency comb (DEFCOM) spectrometer, CRF researchers Haifeng Huang and David Chandler are refining a new concept for time-resolved Fourier-transform (FT) spectroscopy based on the interference between two transient frequency combs. By opening the door to many potential uses—including time-resolved, high-resolution, broad-band spectroscopy with a microsecond time-scale—DEFCOM may prove instrumental in monitoring chemically dynamic systems that require simultaneous monitoring of several species.
DEFCOM uses two independent etalons to generate two frequency combs, with the comb bandwidth set by the bandwidth of the laser beam used to excite the etalons. The etalon lengths are set to create a gap of ~250 kHz between their free spectral ranges (~300 MHz).
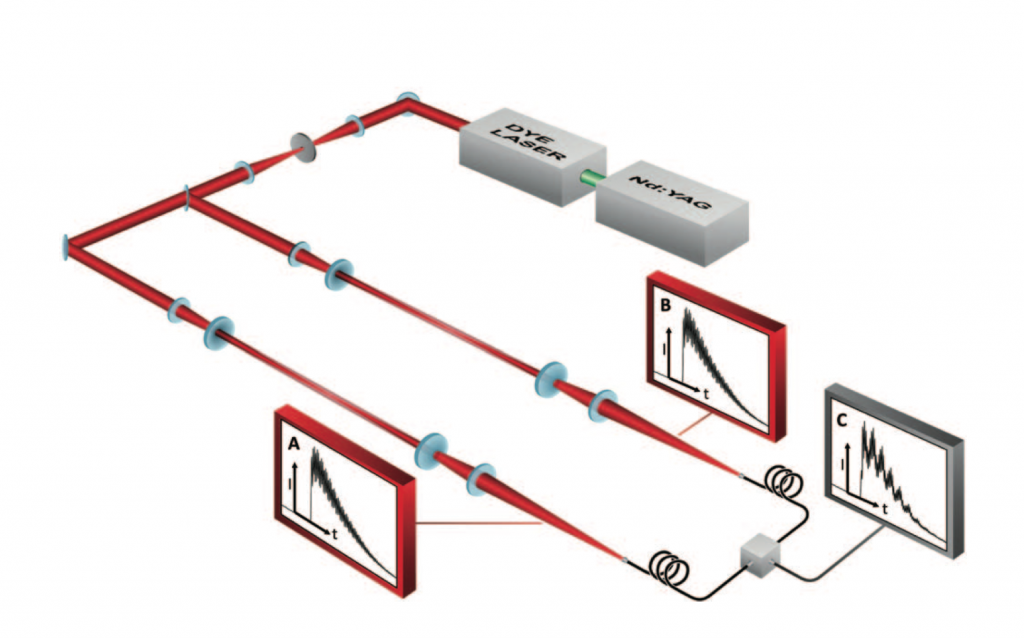
Placed in one or both etalons, an atom or molecule with an optical transition lying within the bandwidth of the laser will absorb some of the light associated with some of the frequency-comb teeth. To quantitatively determine each comb frequency’s intensity, the etalon optical outputs are combined onto a single photo detector. At the detector, the outputs interfere, producing a transient interferogram. Figure 1, a schematic of the spectrometer, shows the characteristic intensity ring down in time that each etalon generates, as well as the signal the combined etalon outputs generate. The spectrum is retrieved by Fourier transforming the interference pattern.
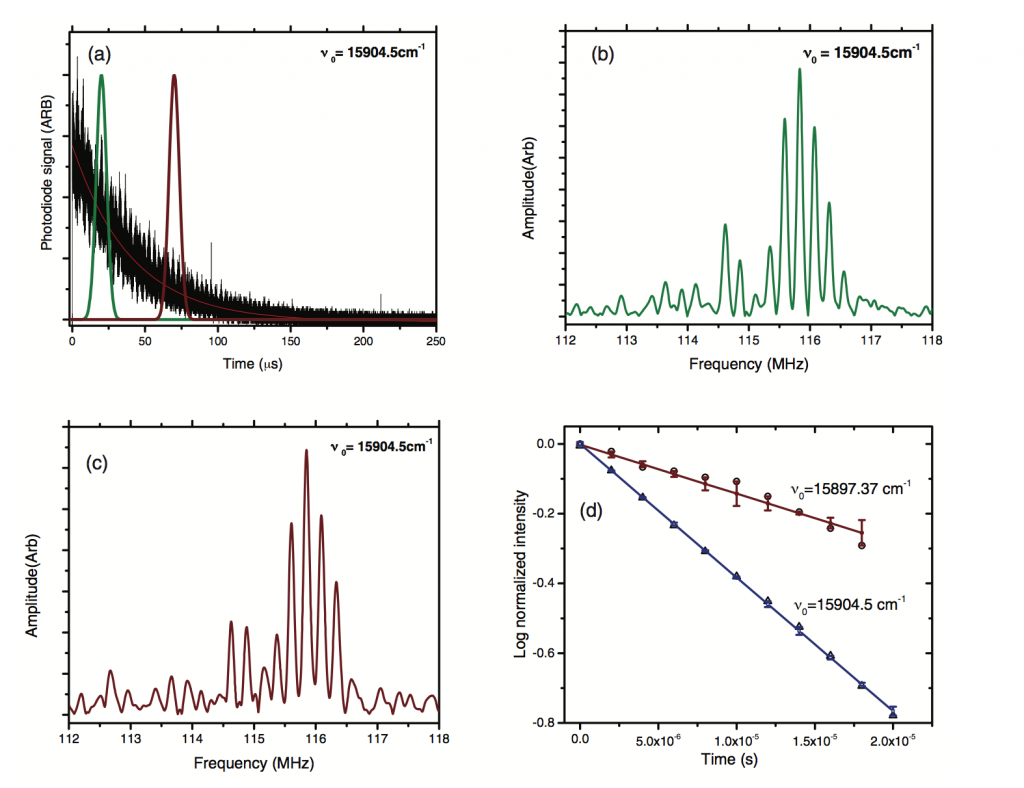
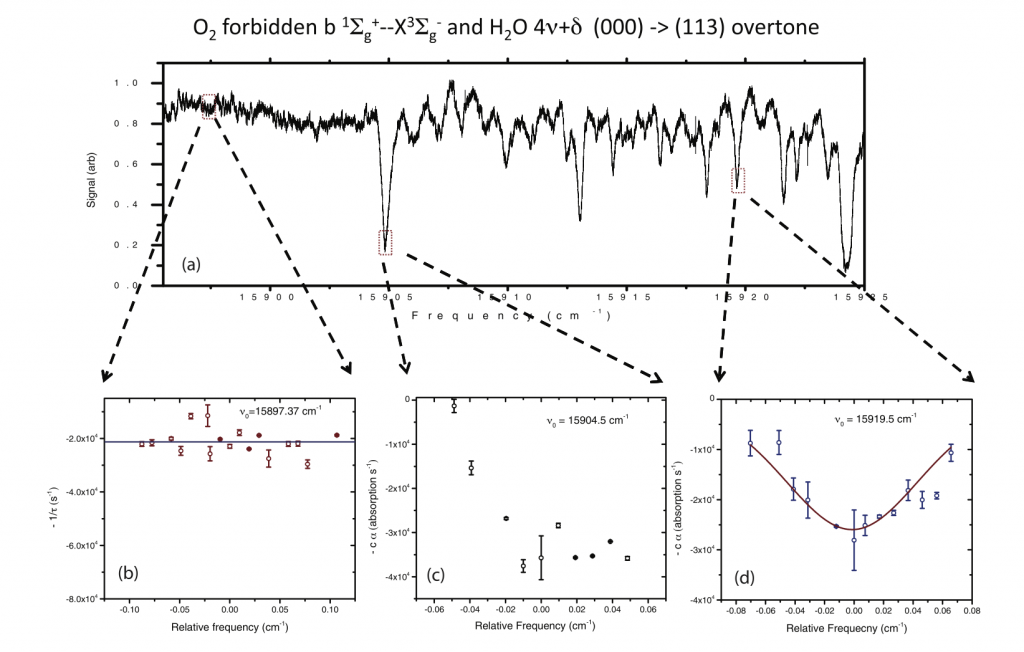
As demonstrated in Figure 3, plotting etalon mode decay rates yields a high-resolution spectrum. Specifically, Figure 3 shows spectra of the (1,1,3) vibrational overtone transition of water (H2O) and the R(7) transition of the weak gamma band of oxygen (O2). A single laser pulse with a 3 GHz broad spectrum provides the input light for the spectrometer. Given the etalons’ ~300 MHz resolution (spacing between etalon modes), a single laser pulse excites ~15 modes (see Figure 2B and C). Because the molecules are within the etalon cavities, they have an effective absorption path length of 30 km, giving very high sensitivity to the absorption measurement.
The current version of the apparatus provides a 300 MHz resolution spectrum across the laser pulse bandwidth used to excite the etalons. Future versions will enable users to scan the etalon mirrors to obtain even higher resolution, as each comb tooth has a few-tens-of-kilohertz resolution.