Homogeneous charge compression ignition (HCCI) engines can deliver high efficiencies—comparable to a diesel engine or higher—and ultra-low NOx and particulate emissions. They also offer the potential for lower cost than diesel engines and do not require expensive diesel-emissions after treatment for a significantly lower overall package price. HCCI is therefore well suited for future transportation engines; however, the limited power output of these engines is a barrier to their widespread implementation. This load limitation occurs mainly because the cylinder-pressure rise rate (PRR) with combustion increases with increased fueling, eventually becoming so rapid that it causes excessive noise (knock) and even engine damage.
Although the name HCCI implies a homogeneous charge, the charge is never fully homogeneous in practice because heat transfer during the compression stroke combined with convective transport creates thermal inhomogeneities even if the fuel and air are well mixed. This thermal stratification causes combustion to occur sequentially as various parts of the charge reach their autoignition temperatures at different times when they are compressed by the piston. This reduces the combustion rate (and therefore the maximum PRR), allowing considerably higher fueling rates without knock than would have been possible with a fully homogeneous charge. Moreover, computational studies have shown that even modest increases in the thermal stratification, above that which occurs naturally, can allow significantly higher loads without knock. To move toward this goal, it is first necessary to understand the sources and mechanisms responsible for naturally occurring thermal stratification.
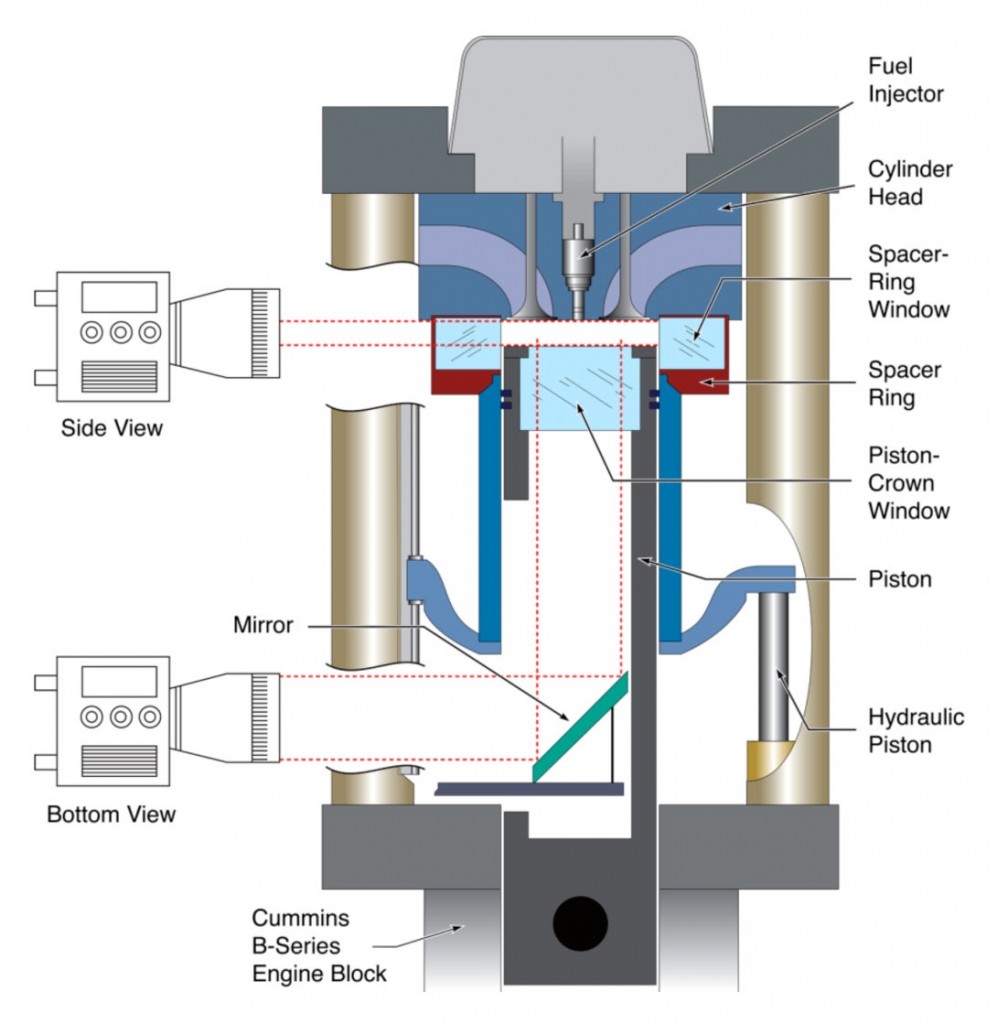
To address this challenge, CRF researchers John Dec and Nicolas Dronniou, previous CRF researcher Wontae Hwang, and visiting researcher Jordan Snyder from Stanford University have been working to provide a fundamental understanding of the in-cylinder processes related to thermal stratification. Using an HCCI engine modified for optical access (see Figure 1), they applied planar imaging thermometry to obtain two-dimensional temperature maps (T-maps) in various parts of the charge. The thermal imaging diagnostic is based on the temperature sensitivity of planar laser-induced fluorescence (PLIF) of toluene tracer added to the fuel and excited by a 266-nm UV laser. As indicated in Figure 1, two optical configurations were used: (1) a horizontal laser sheet with the PLIF image acquired through the piston-crown window (bottom view), and (2) a vertical laser sheet with the PLIF image acquired through a side window at the top of the cylinder wall (side view).
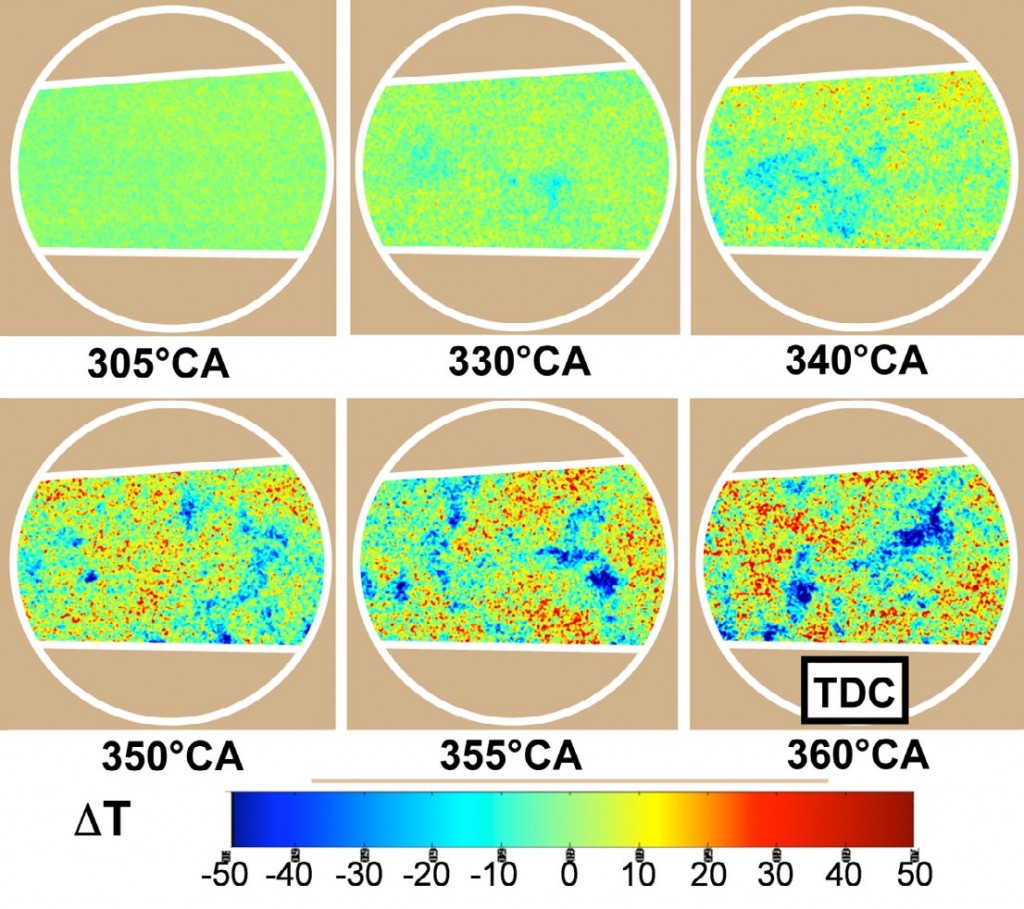
Because previous research (“Imaging thermal stratification in HCCI engines,” CRF News, March/April 2006) has shown that the most critical thermal stratification for controlling the PRR is that occurring within the bulk gas, the researchers first studied the development of bulk-gas thermal stratification using the bottom-view optical configuration. Figure 2 shows a temporal sequence of T-map images in the mid-plane of the combustion chamber during the latter part of the compression stroke. Initially, the bulk-gas temperature is nearly uniform, but beginning at about 330–340 crank angle (CA) degrees some colder regions begin to appear. The number of these cold pockets and their temperature difference from the hotter regions continue to increase through the remainder of the compression stoke. As a result, when autoignition occurs near the end of the compression stroke, significant thermal stratification is present in the central bulk gas, as evident in the 360° top dead center (TDC) image in Figure 2.
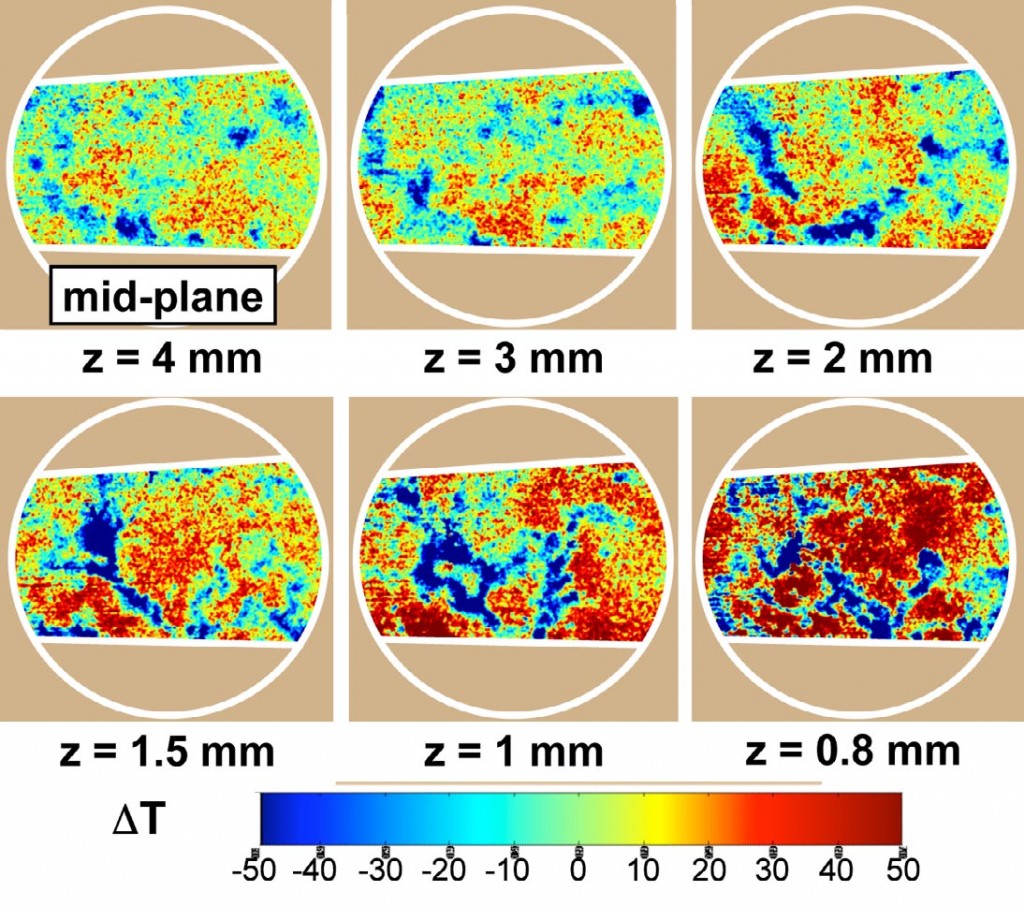
Although the mid-plane images in Figure 2 are representative of the central bulk-gas, it is also important to understand how the thermal stratification changes for the regions nearer the wall. Figure 3 shows a spatial sequence of T-map images at TDC acquired as the laser sheet was traversed from the mid-plane (z = 4 mm) to a position 0.8 mm from the cylinder-head surface. These results show that the amount of thermal stratification is similar from the mid-plane to a plane halfway to the wall (z = 2 mm), but beyond this halfway position (z < 2 mm), the temperature variation within the T-maps increases significantly. The T-maps in Figure 3 also show that in this outer boundary-layer region (2 mm ≤ z ≤ 0.8 mm), the character of the thermal stratification has changed. Rather than the more round individual cold pockets in the central region, the cold zones now appear as more narrow elongated regions that are suggestive of vortex tubes, which could be responsible for transporting the colder fluid very near the wall into the bulk gases.
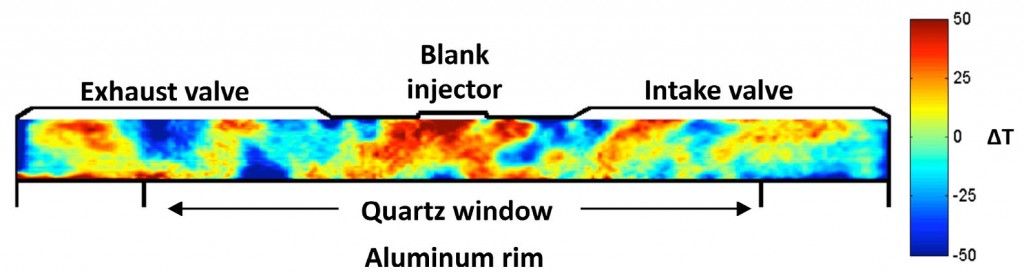
To further study the transport of cold near-wall gases into the central region, side-view images were acquired. Figure 4 shows an example of a typical side-view T-map acquired at TDC. This singlecycle image shows considerable thermal stratification throughout the charge; however, side-view T-maps averaged over multiple cycles show no thermal stratification beyond thin boundary-layer regions, indicating the random (turbulent) nature of the cold-gas regions that extend beyond this thin boundary layer into the bulk gas. Another key finding from Figure 4 is that virtually all the cold-gas regions in the central charge are parts of larger cold-gas structures that extend from the cylinder-head or piston-top surfaces. This finding agrees well with the near-wall images of Figure 3, suggesting that the cold-gas structures in Figure 4 are cuts through vortex tubes that convect the cold near-wall gases into the central region. Continuing the development of this three-dimensional picture, these results also show that the thermal stratification in the mid-plane images in Figures 2 and 3 does not consist of isolated cold pockets, but results because these images are cut planes through the tips of the turbulent cold-gas structures in Figure 4.
These combined results greatly increase understanding of the mechanisms responsible for producing thermal stratification in HCCI engines. They suggest that the thermal stratification primarily results from convective transport by large-scale turbulent vortices (eddies), and that the quest to enhance the thermal stratification to obtain higher loads without knock should focus on methods to supplement these flows. Toward achieving this, a two-pronged approach is planned in which advanced Large Eddy Simulation (LES) modeling will be applied to help guide experimental efforts.