A recently concluded CRF study as revealed the important role of combustion in the efficient operation of cellulosic ethanol plants for producing biofuels. Unlike ‘first-generation’ ethanol derived from the fermentation of sugar or starch sources (such as corn), future production of ethanol in the United States is expected (and indeed is federally mandated) to increasingly utilize lignocellulosic biomass such as crop residues, fast-growing wood, or herbaceous energy crops. Lignocellulosic biomass sources generally do not compete with the production of food crops; additionally, they offer much lower effective carbon emissions than current bio-ethanol and biodiesel sources. Research and development of this ‘secondgeneration’ ethanol process is largely focused on making improvements to the biochemical processes that convert cellulose and hemicellulose polysaccharides to sugars that are fermented to ethanol.
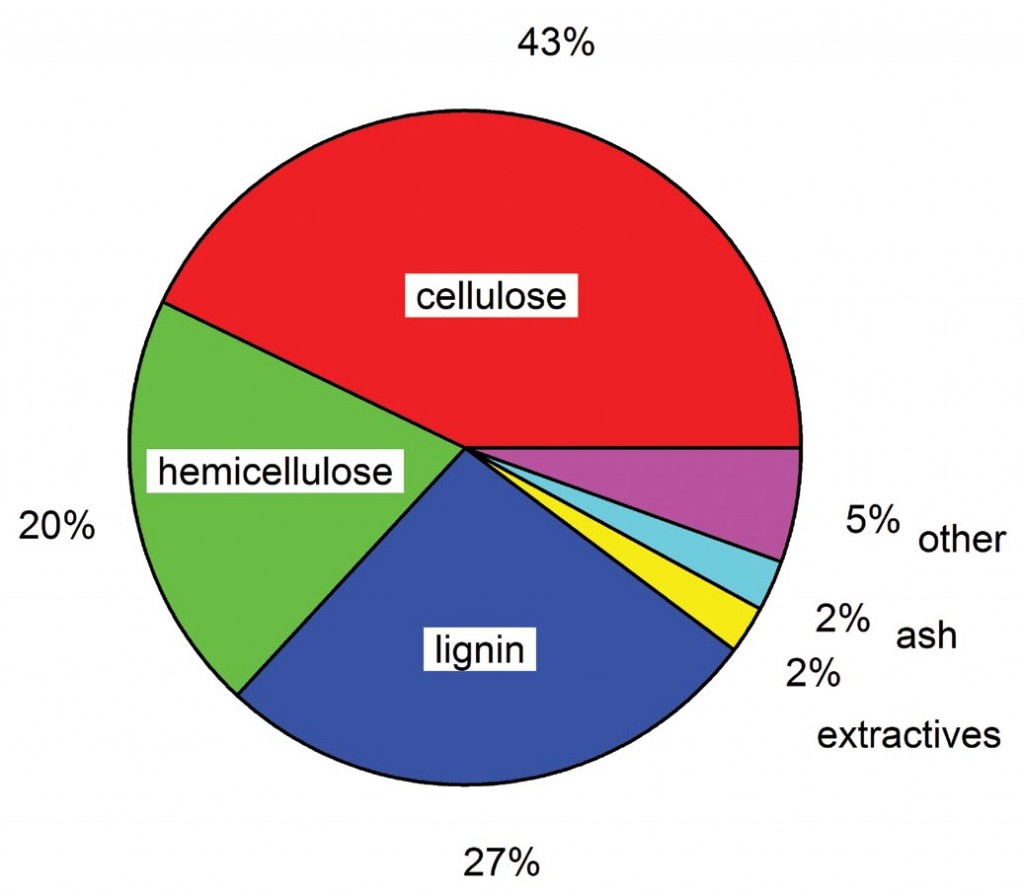
However, as shown in Figure 1, typical lignocellulosic biomass sources only contain 60–70% polysaccharides, so optimization of second generation bio-ethanol production also requires that the remainder of the biomass, predominately lignin, be effectively utilized.
The research project, funded under Sandia’s Laboratory Directed Research and Development (LDRD) program, evaluated the combustion properties of practical lignin residues produced by several alternative approaches to bio-ethanol production (“Combustion properties of biomass lignin residues determined,” CRF News, March/April 2011) and also analyzed efficiency losses in a representative bio-ethanol plant configuration.
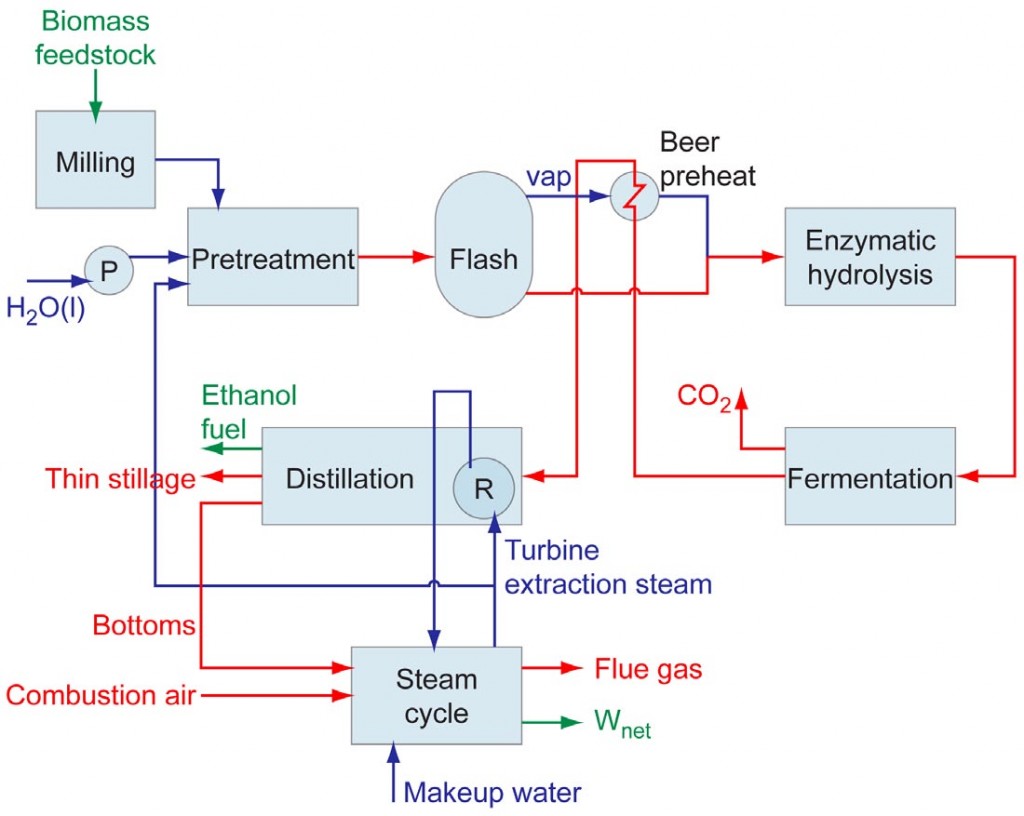
Andy Lutz and postdoctoral researcher Kwee-Yan Teh analyzed the energy and exergy balances of a prototypical lignocellulosic biochemical ethanol plant design in which the lignin residue is burned to produce steam that is required for heating during the feedstock pretreatment and ethanol distillation processes. A schematic of the modeled system is shown in Figure 2. The performance parameters for each of the primary system processes were taken from a 2009 National Research Council study that evaluated current state-of-the-art technology as well as possible process improvements that may be attainable in the future.
The results of the energy and exergy analyses for the current state-of-the-art cellulosic ethanol plant performance are shown in Figure 3. The energy balance shows an ethanol production energy efficiency of 30%, with extensive heat losses accounting for most of the process inefficiency. The exergy analysis, which provides a more detailed evaluation of system inefficiencies, reveals that the lignin residue combustion steam cycle itself is the ultimate source of most of the inefficiency. However, extensive steam production is currently needed in cellulosic ethanol plants to provide the necessary heating for process components such as biomass pretreatment and ethanol distillation, so this exergy loss is somewhat unavoidable.
Future bio-ethanol process efficiency improvements are expected to occur in reducing the temperature of pretreatment (thereby lowering its demand for steam) and in the development of low-energy approaches to ethanol distillation such as membrane vapor permeation technology. With these innovations, the exergy analysis reveals a significant opportunity to improve the overall process efficiency through enhanced utilization of the lignin residue, for example by generating additional fuel products via pyrolysis or gasification.
