Technical Details
Research and development efforts both inside and outside the Labs are aimed at providing a fundamental understanding of cryogenic hydrogen dispersion and flames. Experiments are used to validate models that are, in turn, used to inform safety, codes and standards for infrastructure that uses liquid hydrogen, such as a large fueling station for a fuel cell electric vehicle.
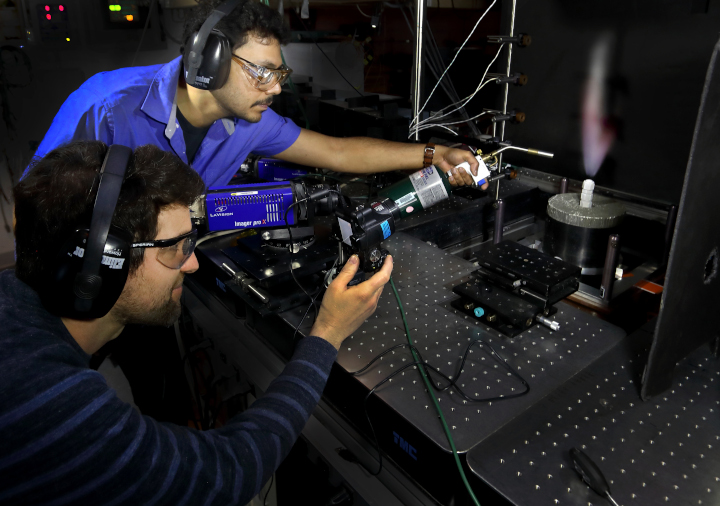
Figure 1 Ethan Hecht (front) and Bikram Roy Chowdhury (back) study a cryogenic hydrogen flame in the turbulent combustion laboratory.
Key Contributions
- Inside the turbulent combustion laboratory, planar laser Raman imaging and particle imaging velocimetry are used to measure the dispersion of cryogenic hydrogen. Thermocouples and radiometers are used to measure the heat flux from flames. The resulting data are used to validate fast running models that are coupled to probabilistic models of leak frequency to quantitatively assess risk of hydrogen infrastructure. See the Hydrogen Risk Assessment Model site for additional information on the models and risk assessment toolkit.
- Partnering with Lawrence Livermore National Laboratory, we are studying the dispersion of large cryogenic hydrogen releases are measured using line-imaging of Raman scattering. Data from these experiments are used to assess the scalability of the models from the lab-scale to something larger, and to evaluate the effects of wind and humidity on the dispersion of cryogenic hydrogen.

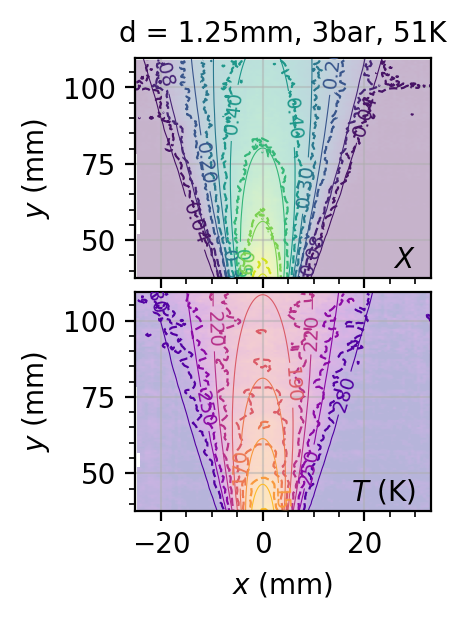
Figure 2 Sketch of the simultaneous planar laser Raman imaging and particle imaging velocimetry (PIV) setup in the lab. Lasers and diagnostics remain fixed while the release point is moved in 3D to build up a full picture of the cryogenic hydrogen releases.
Figure 3 Example of the laboratory planar laser Raman imaging data being used for model validation. Contours of mole fraction (top) and temperature (bottom) are calculated from the Raman images and shown by the shading and thick, dashed lines. The model contours are shown by the thin, solid lines, for a single cryogenic hydrogen release.
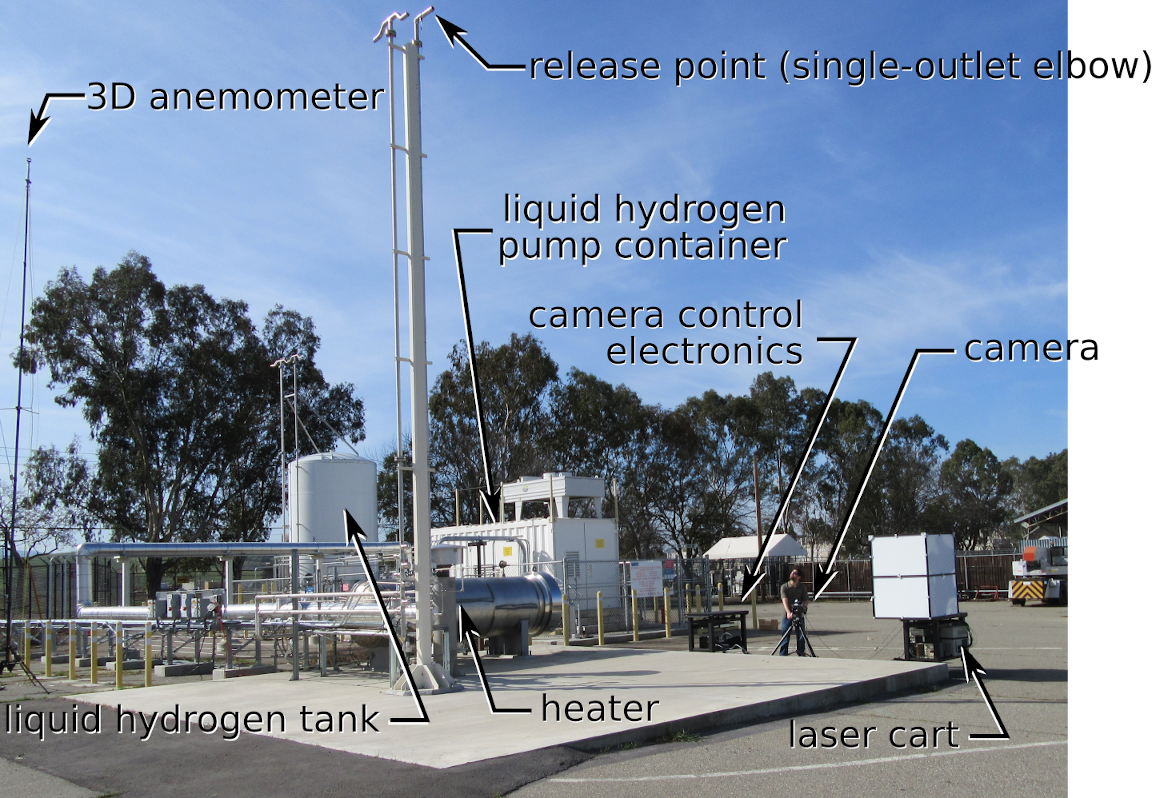
Figure 4 A mobile laser diagnostic system developed by researchers at the CRF is used at the Lawrence Livermore National Laboratory’s Liquid Hydrogen Test Facility to measure large releases of cryogenic hydrogen.
Figure 5 As cryogenic hydrogen is released, condensed moisture in the plume is clearly visible in the images (right). The laser rasters in-line with the release (x) direction. As the wind changes, the visible plume straightens out at frame 30 and the Raman signal from hydrogen is detected.
Partners
Funding support:
- U.S. Department of Energy, Energy Efficiency & Renewable Energy, Fuel Cell Technologies Office: Safety, Codes, and Standards subprogram, managed by Laura Hill
- Industry support, including the OEM Group at the California Fuel Cell Partnership, Linde, and Shell
- Air Liquide and partners
PI: Ethan S. Hecht